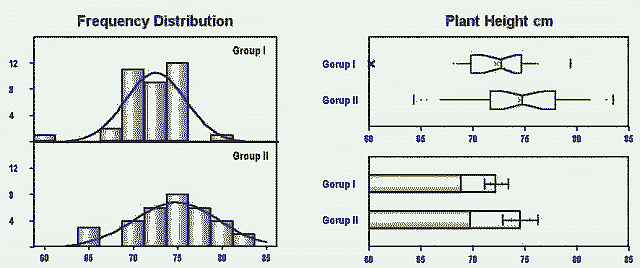
| Source of Variations | df | Sum of Squares | Mean Squares | F Ratio | Probability | h² | hp² | w² | |
| Between Groups | 1 | 93.25685 | 93.25685 | 5.432 | 0.0228 | * | 0.075 | 0.075 | 0.057 |
| Within Groups | 67 | 1150.361 | 17.16956 | ||||||
| Total | 68 | 1243.617 | 18.28849 | ||||||
| Group I | Group II | Pooled | S.E.D. | CD 95% | Estimation of Effect Size | |||
| n | 36 | 33 | 69 | Cohen's d | 0.569 | |||
| Mean µ | 72.2072 | 74.5345 | 73.3203 | 0.9986 | 1.9932 | Percentile Standing | 71.50% | |
| Std. Dev. | 3.4005 | 4.8271 | Non-overlap % | 36.60% | ||||
| Std. Error | 0.5668 | 0.8403 | Hedges g | 0.562 | ||||
| Test Value | (µ1-µ2) | +/- | Lower Limit | Upper Limit | ||||
| T-Test | 2.3306 | -2.3273 | 1.9932 | -4.3205 | -0.3341 | ES Correlation | 0.274 | |
| Modified T-Test | 2.2962 | -2.3273 | 2.0624 | -4.3897 | -0.2649 | |||
| Variance Ratio Test | 2.015 | 0.0225 | (F Prob) | 1.0162 | 3.9954 | Variances are not the same in 2 groups | ||
| Levene's Test | 3.0939 | 0.0832 | (F Prob) | |||||
| Brown-Forsythe Test | 2.942 | 0.0909 | (F Prob) | |||||
| MANN WHITNEY Test | 402 | 0.0104 | Prob (1 tailed) | -4.32 | -0.42 | |||
